In this article9 sections
Most rental property calculators show you a formula and a blank box. This article walks the formula through one full example, start to finish, using a hypothetical property built specifically to teach the math. It is not a real listing or a real client's deal. It's a realistic composite, built from typical numbers in an affordable Midwest metro, so you can see exactly how the five core metrics connect before you run them on a real property.
This article is for first-time investors who understand the individual formulas (NOI, cap rate, cash-on-cash return) in isolation but haven't seen them applied to one property from listing to final go/no-go decision. If that's you, follow the numbers below with a calculator open and rerun them yourself. That repetition is what makes the framework stick.
Key Takeaways
- Five inputs drive every rental analysis: purchase price, financing terms, gross rent, operating expenses, and vacancy.
- NOI (Net Operating Income) = Gross Rental Income minus Operating Expenses, calculated before any mortgage payment.
- Cap rate = NOI ÷ Purchase Price. It ignores financing and tells you how the property performs unleveraged.
- Cash-on-cash return = Annual Pre-Tax Cash Flow ÷ Total Cash Invested. This is the number that reflects your actual leveraged return.
- The same property can flip from a losing deal to a solid one with a 5-10% shift in purchase price or a realistic vacancy assumption. Small inputs move outcomes more than beginners expect.
The example property
The scenario (illustrative, not a real listing): a duplex in a mid-size Midwest metro, listed at $180,000. Each unit is a 2-bedroom, currently renting for $1,050/month, both occupied.
- Purchase price: $180,000
- Down payment: 20% conventional investment loan ($36,000)
- Loan amount: $144,000 at 7.25% fixed, 30-year term
- Gross rent: $1,050/unit × 2 units = $2,100/month ($25,200/year)
- Closing costs: ~3% of purchase price ($5,400)
- Total cash invested: $36,000 down payment + $5,400 closing + $3,000 initial repair reserve = $44,400
Step 1: Verify the rent assumption
Before trusting the listing agent's rent numbers, check them against an independent source. HUD's Fair Market Rents (FMR) data publishes the 40th-percentile rent by county and metro area, which is a useful sanity check even if you're not renting to voucher tenants. If the listed rent is well above the local FMR for a comparable unit size, treat it as optimistic until you confirm it with your own comps.
In this example, assume the $1,050/unit figure checks out against both the FMR data and 3-4 comparable active listings nearby. That verification step alone eliminates one of the most common first-deal mistakes: underwriting to a rent number the market won't actually support.
Step 2: Build the operating expense budget
Operating expenses are everything it costs to run the property, before the mortgage. Skipping line items here is the single biggest reason first-time analyses look better than the real deal turns out to be.
| Expense | Monthly | Annual | Basis |
|---|---|---|---|
| Property taxes | $225 | $2,700 | 1.5% of price, typical Midwest rate |
| Insurance | $125 | $1,500 | Landlord policy estimate |
| Vacancy reserve | $126 | $1,512 | 6% of gross rent |
| Maintenance/repairs reserve | $210 | $2,520 | 10% of gross rent (older duplex) |
| Capital expenditure reserve | $105 | $1,260 | 5% of gross rent (roof, HVAC, water heater over time) |
| Property management (if used) | $210 | $2,520 | 10% of gross rent |
| Total operating expenses | $1,001 | $12,012 |
This example includes a property management line even though a self-managing owner-occupant wouldn't pay it. Include it anyway when you first underwrite a deal. If you decide to self-manage, that line becomes margin, not a number you were counting on that later disappears if you burn out on managing it yourself. For the full list of expense categories first-time buyers tend to forget, see hidden costs of owning rental property.
Step 3: Calculate NOI
NOI = Gross Rental Income − Operating Expenses
NOI = $25,200 − $12,012 = $13,188/year
Notice what's not in this number: the mortgage payment. NOI measures how the property performs as an asset, independent of how you financed it. That's intentional. It's the number appraisers and commercial lenders look at first, and it's what makes a property comparable across different buyers with different loan terms. See how to calculate NOI on a rental property for a deeper breakdown of what belongs in the expense side.
Step 4: Calculate cap rate
Cap rate = NOI ÷ Purchase Price
Cap rate = $13,188 ÷ $180,000 = 7.3%
A 7.3% cap rate is a reasonable, unspectacular number for a Midwest duplex in a stable but not high-growth market. Cap rates vary significantly by market and property class, so a "good" cap rate in one metro can be mediocre in another. Use cap rate to compare this property against other properties in the same market, not as an absolute pass/fail line on its own. See how to calculate cap rate and cap rate vs. cash-on-cash return for how these two metrics complement each other.
Step 5: Layer in financing and calculate cash-on-cash return
Now bring the mortgage into the picture. At 7.25% on a $144,000 loan, 30-year amortization, the principal and interest payment is approximately $983/month, or $11,796/year. Rates shift with the broader mortgage market; check Freddie Mac's Primary Mortgage Market Survey for the current weekly average before you lock a rate on a real deal.
Annual pre-tax cash flow = NOI − Annual Debt Service
Cash flow = $13,188 − $11,796 = $1,392/year, or $116/month
Cash-on-cash return = Annual Cash Flow ÷ Total Cash Invested
Cash-on-cash = $1,392 ÷ $44,400 = 3.1%
This is the number that actually reflects your leveraged return on the cash you put in, and it tells a different story than the cap rate does. The property is cashflow-positive but thin. Add mortgage paydown (the portion of each payment reducing principal, which is real equity building even though it's not cash in your pocket) and the total return picture improves, but the cash-in-pocket number on its own is not a large cushion.
Step 6: Stress-test the deal
A thin cushion means small changes matter. Run the same numbers two ways:
If vacancy runs higher than budgeted (one unit empty for one month a year instead of the 6% reserve covering it): that's roughly $1,050 in lost rent, more than the entire annual cash flow. A single below-average vacancy year takes this deal to breakeven or slightly negative.
If the purchase price were $165,000 instead of $180,000 (a 8% lower entry, achievable through negotiation or finding a similar property priced lower): total cash invested drops to roughly $41,000, the loan drops to $132,000, and the debt service drops to about $10,825/year. NOI stays the same at $13,188 (operating expenses don't change with price). New cash flow: $13,188 − $10,825 = $2,363/year, or $197/month. Cash-on-cash improves to 5.8%, a meaningfully more comfortable margin.
The lesson from this example: at $180,000 this deal is workable but thin. At $165,000, the same property is a genuinely solid first deal. Purchase price, more than any other single input, is what a first-time buyer actually controls at the negotiating table.
The go/no-go decision
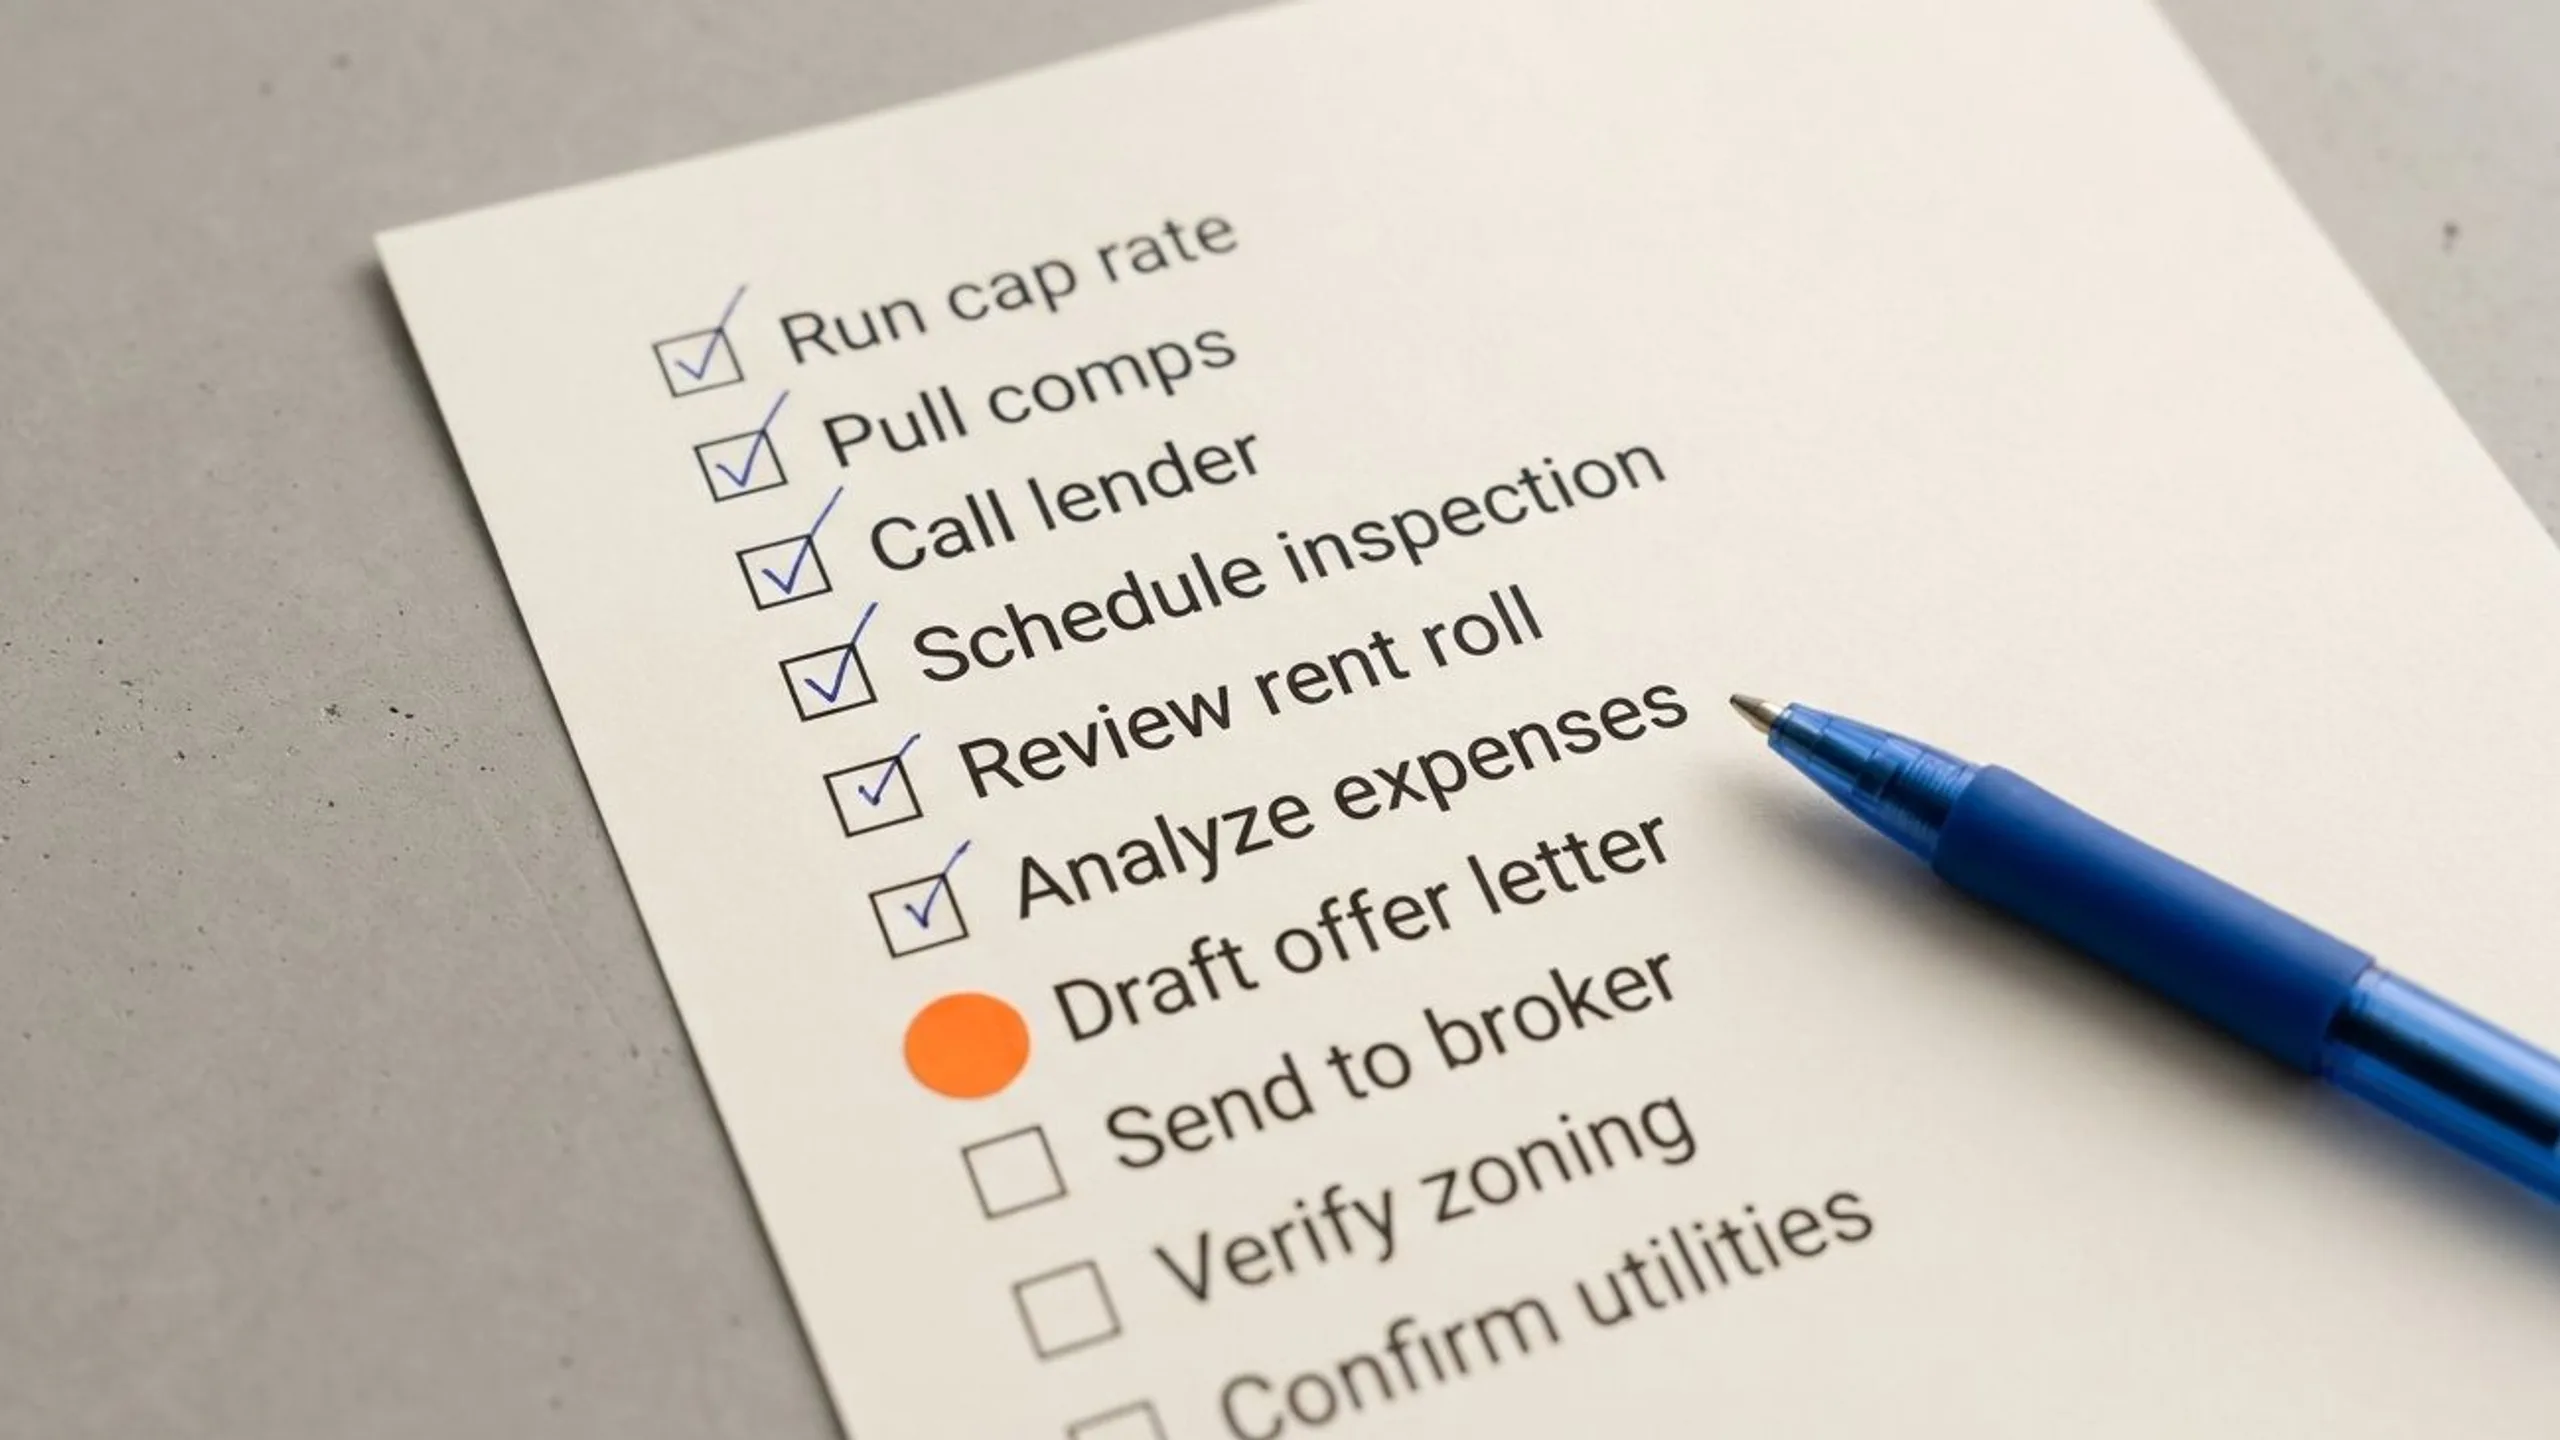
Before making an offer, a first-time buyer should be able to answer yes to all of the following on their own numbers, not the listing agent's:
- Does NOI cover debt service with a positive margin, even before counting appreciation or tax benefits?
- Does the cash-on-cash return clear your personal minimum threshold (many first-time investors target 6-8%, though markets and strategies vary)?
- Does the deal still cash flow, even barely, if vacancy runs above your reserve for one bad year?
- Have you verified rent against independent data, not just the seller's pro forma?
If the answer to any of these is no, the fix is usually price, not the property itself: renegotiate, walk away, or find comparable inventory at a lower basis. Before you make an offer, run through a home inspection checklist so your maintenance reserve reflects the property's actual condition, not just an average. Our rental cashflow calculator runs this exact sequence so you can test your own numbers. The 28-day course covers deal analysis and negotiation strategy in week four, applied to properties you're actually considering. If you would rather not maintain the spreadsheet yourself, a DealCheck review for first-time investors covers the main software option and where it still makes you do the thinking.
Frequently Asked Questions
Is this a real property or a real deal?
No. This is a hypothetical, composite example built with realistic numbers for a mid-size Midwest metro, designed to teach the analysis framework end to end. Real deals require you to verify every input (rent, taxes, insurance, condition) against the actual property and market, not this example.
What's a good cash-on-cash return for a first rental property?
There's no universal number, but many first-time investors target 6-8% as a starting benchmark, adjusting for market and strategy. A lower return (like the 3.1% in the initial version of this example) isn't automatically disqualifying if appreciation potential or mortgage paydown make up the difference, but it leaves little room for error.
Why does the analysis include a property management fee even for a self-managed property?
Underwriting with a management fee included tests whether the deal works even if you eventually hire help or step away from self-managing. If you self-manage and the deal still only works because you're not paying yourself for the work, that's valuable information, not a hidden cost you can ignore.
What's the biggest input first-time investors get wrong?
Underestimating maintenance and capital expenditure reserves. Skipping or shrinking these two line items is the most common way a spreadsheet shows a healthy cash-flowing property that turns out to be break-even or worse once a water heater or roof needs replacing.
How does depreciation change this picture?
Depreciation doesn't change the cash-flow numbers above, but it changes the after-tax picture. Residential rental property depreciates over 27.5 years per IRS Publication 527, which can shelter a meaningful share of this property's $1,392-$2,363 in cash flow from taxation in the early years of ownership. It's a real benefit, but it's separate from whether the deal cash flows on its own operating merits.
Should I trust the seller's or agent's expense numbers?
Verify them independently. Tax bills are public record. Insurance quotes take one phone call. Rent should be checked against HUD's FMR data and live comparable listings, not just the seller's current lease. A seller's pro forma is a starting point for questions, not a number to underwrite to directly.
The math itself isn't complicated. NOI, cap rate, and cash-on-cash return are five inputs run through three formulas. What separates a good first deal from a bad one is whether every input got verified against something outside the listing, and whether the deal still works after a stress test, not whether the spreadsheet looked good on the first pass.
This article is education, not financial, legal, or tax advice. Real estate carries risk, and the numbers here are examples. Check them against your own market and talk to a licensed professional before you buy.