Rental Property Statistics 2026 (Sourced Data)
Rental property statistics for 2026 start with one number: about 45.0 million U.S. households rent their home, roughly 34.8% of all households, per the U.S. Census Bureau American Community Survey. Median gross rent is $1,413 a month, the rental vacancy rate sits at 7.3%, and the typical renter spends 30.6% of household income on rent. Those four figures frame the entire market a first-time investor is buying into.
This article is for beginners who want the real numbers behind U.S. rentals, and for anyone (writers, students, planners) who needs a sourced, current statistic to cite. Every figure below names its source and date. Where a number shapes a real buying decision, we link to the guide that puts it to work.
Key Takeaways (2026)
- 45.0 million U.S. households are renters, 34.8% of all households (Census ACS 2024).
- $1,413 median gross rent per month nationally (Census ACS 2024).
- 7.3% rental vacancy rate in early 2026 (Census Housing Vacancy Survey).
- 30.6% of household income is what the median renter spends on rent, right at the cost-burdened line (Census ACS 2024).
- 65.2% homeownership rate, leaving a large, stable renter pool.
How many renters are there
- 45.0 million renter households, out of 129.2 million occupied households (Census ACS 2024).
- 34.8% of households rent; 65.2% own (the homeownership rate).
- The U.S. has about 143.8 million total housing units and a population near 334.9 million.
The takeaway for an investor: the renter pool is huge and steady. A homeownership rate parked in the mid-60s for years means roughly one in three households is a potential tenant, which is why residential rentals stay a durable asset even when any single market wobbles.
Rents and affordability
- $1,413 median gross rent per month (Census ACS 2024). Gross rent includes tenant-paid utilities. Newly listed asking rents usually run higher, since this figure reflects all existing leases.
- 30.6% of household income is what the median renter pays in gross rent (Census ACS 2024), right at the 30% line economists use to define a household as cost-burdened.
That 30.6% number is the ceiling most markets bump against. It is why rent cannot rise faster than local incomes forever, and why market selection (buying where incomes support rents) matters more than chasing the highest headline rent. See how to pick a city for real estate investing and the ranked best cities for house hacking, which uses this exact rent-to-income logic.
Home values and the buy side
- $332,700 median home value (Census ACS 2024).
- $80,734 median household income (Census ACS 2024).
- That is a national price-to-income ratio of about 4.1x, which is why affordable Midwest and Southern metros (often 2.5x to 3.5x) are where a first purchase on a normal salary is most reachable.
For beginners, the gap between the national median and an affordable metro is the whole game. A $102,000 Cleveland home against a $332,700 national median is the difference between a reachable first deal and a stretch. Run any specific property through how to calculate cap rate and the 1% rule before trusting a headline price.
Regional variation: the national number hides everything
National medians are averages of wildly different markets, and for a beginner the spread is the opportunity, not a footnote. The $332,700 national median home value sits between metros like Cleveland (around $102,000) and coastal cities several times higher. Median gross rent varies just as much: the $1,413 national figure masks markets well under $1,000 and others above $2,000.
This is why "national rent rose X%" headlines are close to useless for picking a property. What matters is the rent-to-price and rent-to-income of the specific submarket you buy in. Two cities with identical median rents can deliver completely different returns once price is factored in. That is the entire reason a ranked list of best cities for house hacking is more useful to a first-time buyer than any national average. The practical rule: never underwrite off a national statistic. Use it to sanity-check, then pull local rent comps and local prices for the exact neighborhood.
Vacancy and demand
- 7.3% rental vacancy rate in early 2026 per the Census Housing Vacancy Survey, near its decade-long 6% to 7.5% band.
- That supports the standard underwriting assumption of roughly one vacant month per year (about 8%) per unit.
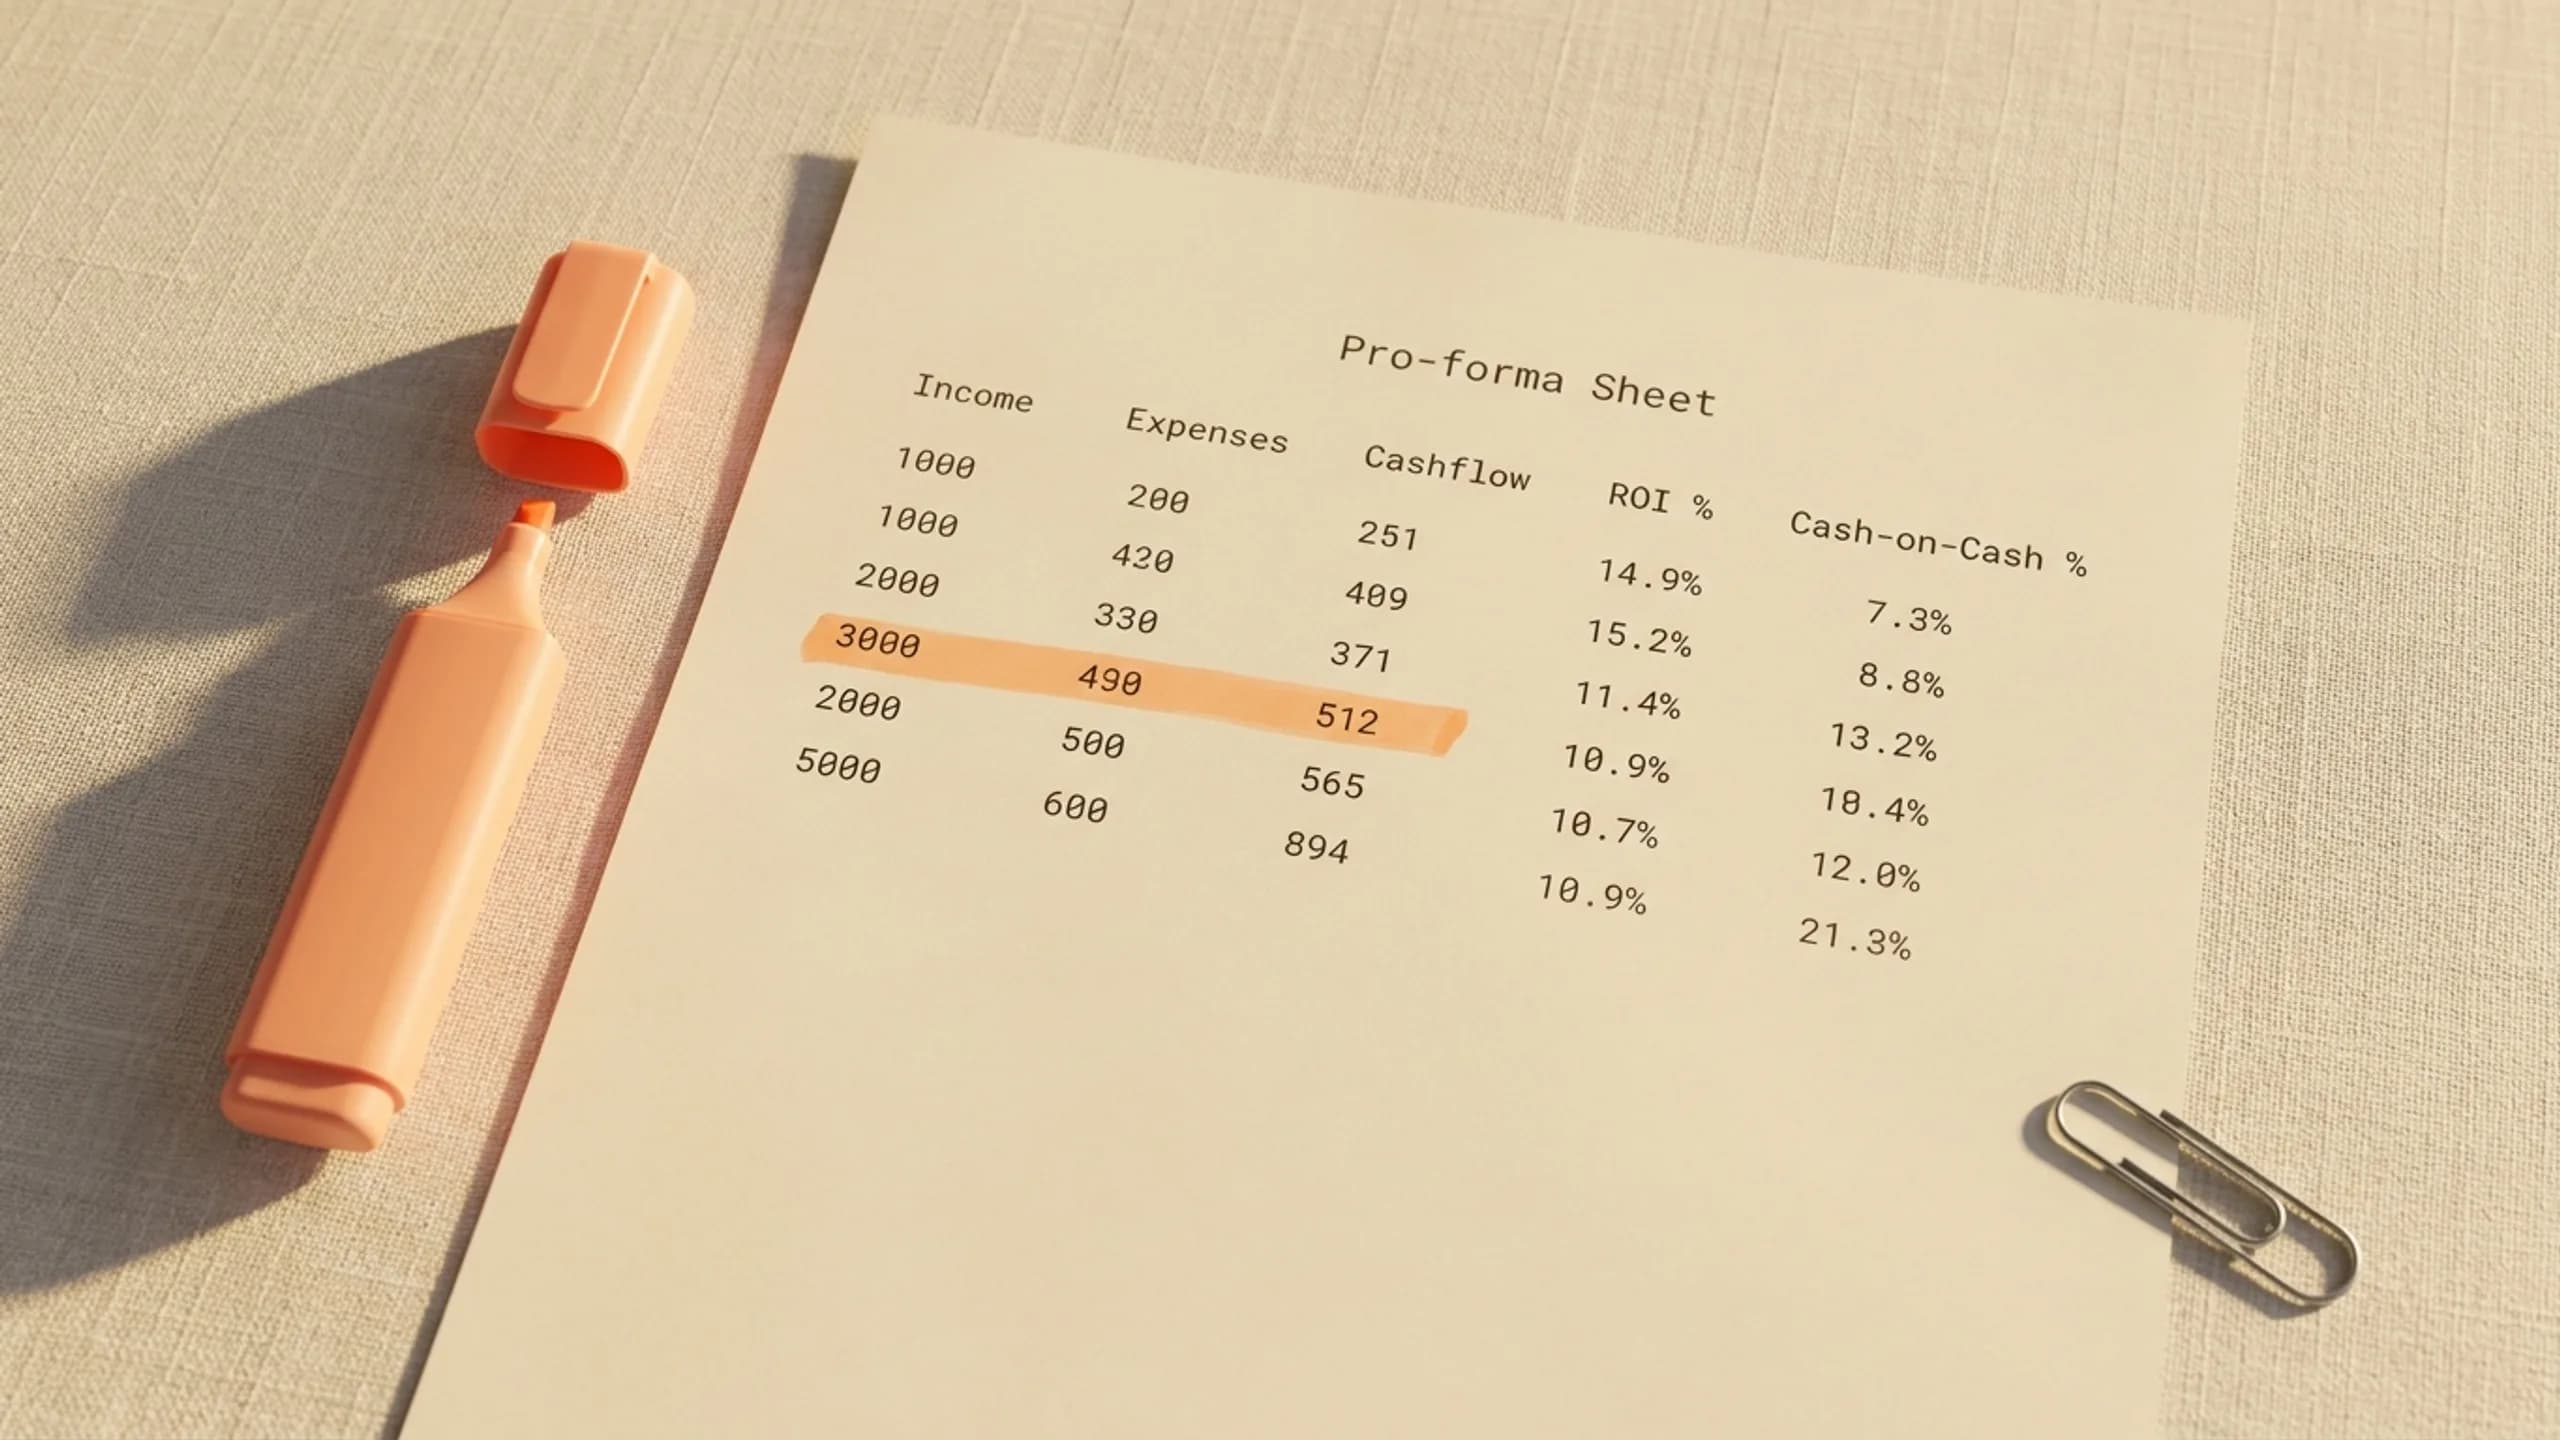
Vacancy is the quiet cashflow killer beginners forget to budget. Build it into every pro-forma and hold reserves against it. See first-time landlord mistakes for the operational traps, and size your buffer with how much cash reserves to keep.
Who rents, and why
Tenant demand tracks two forces beginners underrate: people moving, and how they work.
- Roughly 1 in 8 Americans moves each year, per Census tracking of annual mover rates. Every move is a potential lease.
- 13.8% of workers worked primarily from home in 2023, per the Census Bureau. Remote and hybrid work reshapes which submarkets fill and which tenant types (including furnished mid-term renters) exist at all.
Two structural forces keep the renter pool refilling. New households keep forming as young adults move out on their own, and homeownership stays gated by down payments and prices, so millions rent for years before (or instead of) buying. For an investor, that means demand is broad and durable: the question is almost never whether tenants exist, only whether you bought the right unit at a price the local rent can carry.
What these numbers mean for a first deal
National statistics set the backdrop; they do not pick your property. Here is how to translate them into action:
- The renter pool is deep, so demand is rarely the problem. Your job is buying the right unit at the right price, not proving that renters exist.
- Rents are capped by local incomes (30.6% nationally). Buy where incomes support rent, using FHA vs conventional financing for house hacking to keep your entry cost low.
- Budget 7% to 8% vacancy and real reserves. The averages are averages; a single bad month sinks an under-funded deal.
- Analyze the actual property, not the national median, with how to analyze a house hack before you buy. Financing cost matters too, so track the current 30-year mortgage rate.
- Treat every average as a question, not an answer. Each figure here should trigger a local check: is my metro cheaper or pricier than the $332,700 median, does my tenant have headroom below the 30.6% rent-to-income line, is my submarket's vacancy under or over 7.3%. The national numbers exist to show you what normal looks like, so you can tell when a specific deal is clearly better or clearly worse than normal.
Sources and methodology
All figures are the most recent available as of July 2026. Household, rent, value, income, and homeownership figures come from the U.S. Census Bureau American Community Survey 2024 estimates. The rental vacancy rate comes from the Census Housing Vacancy Survey (early 2026). Mobility and work-from-home figures come from Census Current Population Survey and ACS releases. Mortgage-rate context comes from the Federal Reserve (FRED). Ratios (price-to-income, renter share) are computed directly from the cited Census figures and are reproducible.
Frequently Asked Questions
How many renter households are in the U.S.?
About 45.0 million households rented their home as of the U.S. Census Bureau's 2024 American Community Survey, out of roughly 129.2 million occupied households. That means 34.8% of all U.S. households are renters, and the other 65.2% are owner-occupants.
What is the average rent in the U.S. in 2026?
The median gross rent nationally was $1,413 per month per the Census 2024 American Community Survey. Gross rent includes utilities the renter pays. Asking rents on newly listed units are typically higher than this figure, which reflects all existing leases, not just new ones.
What is the rental vacancy rate in 2026?
The U.S. rental vacancy rate was 7.3% in early 2026 per the Census Bureau's Housing Vacancy Survey. That is close to the long-run average of roughly 6% to 7.5% over the past decade, so budgeting for about one vacant month per year per unit is realistic.
What percentage of income do renters spend on rent?
The typical U.S. renter spends 30.6% of household income on gross rent, per the 2024 American Community Survey. That sits right at the 30% threshold economists use to define a household as cost-burdened, which matters for how much rent a market can realistically support.
What is the homeownership rate in the United States?
About 65.2% of occupied U.S. households were owner-occupied as of the 2024 American Community Survey, leaving 34.8% renting. The homeownership rate has held in the mid-60s for years, which keeps a large, steady pool of renters in the market.
Is 2026 a good time to buy a rental property?
That depends on the specific deal, not the national averages. The numbers here set context, but a good purchase comes down to the property's own rent-to-price, the local market, your financing, and your reserves. Run the actual figures on a real listing rather than deciding from a national statistic.
Statistics describe the market; they do not close a deal. The value in these numbers is context: a deep, stable renter pool, rents capped by local incomes, and vacancy you must budget for. Use them to sanity-check any market, then run the real numbers on a real property. To learn the full path from first analysis to first tenant, the 28-day course walks through it in order.