In this article7 sections
The best cities for house hacking in 2026 are the ones where a small multi-unit property is cheap relative to local incomes and still rents for enough to cover most of your mortgage. By that measure, using U.S. Census data, the strongest markets are Cleveland, Memphis, Pittsburgh, and Birmingham. Each combines a low entry price with high rent relative to home value, which is the whole point of house hacking: live in one unit, rent the others, and let the tenants cover most of the payment.
This article is for beginners deciding where to buy their first house hack, and for anyone tired of "best cities" lists that name places without showing the math. New to the strategy? Start with house hacking for beginners. Every ranking here is built from public Census figures you can check yourself. We rank 14 affordable metros on the two things that actually matter for a first house hack: how affordable homes are relative to local income, and how much rent you collect per dollar of home price.
Key Takeaways
- Cleveland ranks #1 on the data: a $102,000 median home value against $945 median rent is the closest of any big metro to the 1% rule.
- The strongest house-hacking markets cluster in the Midwest and South, where prices stay low but rents hold up.
- We rank on two Census-based metrics: rent-to-value (cashflow potential) and price-to-income (affordability). The methodology below is fully reproducible.
- A low median price is a starting filter, not a verdict. Neighborhood, property taxes, condition, and local rental rules still decide any single deal.
- House hacking works because FHA financing lets you buy a 2-to-4-unit property with as little as 3.5% down while living in one unit. See FHA vs conventional for house hacking.
The ranking
Fourteen affordable U.S. metros, ranked by a combined score of cashflow potential (rent-to-value) and affordability (price-to-income). All figures are U.S. Census Bureau American Community Survey 2024 estimates.
| Rank | City | Median home value | Median gross rent | Rent-to-value | Price-to-income |
|---|---|---|---|---|---|
| 1 | Cleveland, OH | $102,000 | $945 | 11.1% | 2.5x |
| 2 | Memphis, TN | $169,000 | $1,181 | 8.4% | 3.3x |
| 3 | Pittsburgh, PA | $205,800 | $1,261 | 7.4% | 3.1x |
| 4 | Birmingham, AL | $158,800 | $1,107 | 8.4% | 3.4x |
| 5 | Milwaukee, WI | $184,000 | $1,059 | 6.9% | 3.4x |
| 6 | Indianapolis, IN | $224,800 | $1,156 | 6.2% | 3.4x |
| 7 | Oklahoma City, OK | $231,300 | $1,130 | 5.9% | 3.4x |
| 8 | San Antonio, TX | $235,700 | $1,324 | 6.7% | 3.6x |
| 9 | Kansas City, MO | $242,900 | $1,238 | 6.1% | 3.5x |
| 10 | St. Louis, MO | $197,500 | $997 | 6.1% | 3.5x |
| 11 | Columbus, OH | $252,900 | $1,295 | 6.1% | 3.8x |
| 12 | Louisville, KY | $233,900 | $1,120 | 5.8% | 3.5x |
| 13 | Jacksonville, FL | $293,700 | $1,465 | 6.0% | 4.2x |
| 14 | Cincinnati, OH | $230,900 | $1,001 | 5.2% | 4.4x |
These are citywide medians for single-unit homes. Duplex and triplex prices differ, but the citywide ratio is a consistent way to compare affordability and rent strength across metros.
How we ranked them (methodology)
We pulled three figures for each city from the Census ACS: median home value, median gross rent, and median household income. From those we computed two ratios:
- Rent-to-value = annual median rent divided by median home value. Higher is better. It measures how much rent you collect per dollar of home price, which drives cashflow.
- Price-to-income = median home value divided by median household income. Lower is better. It measures how affordable homes are for the people who actually live there, a proxy for how reachable a first purchase is on a normal salary.
Each city is ranked on both metrics, and the two ranks are added. The lowest combined score wins. This rewards cities that are both affordable and cash-flow friendly, not just cheap or just high-rent. You can reproduce every number from the ACS source linked above.
We limited the list to 14 mid-sized metros already known for entry-level affordability. We left out high-cost coastal metros (they fail both metrics badly) and very small towns (thin rental demand).
The top markets, briefly
Cleveland, OH. The standout. A $102,000 median value against $945 rent gives an 11.1% rent-to-value ratio, the only metro here that comes close to the 1% rule (about 0.93% of price in monthly rent). Affordability is also best in class at 2.5x income. The tradeoff: slower appreciation and neighborhood-by-neighborhood variation are real, so screening the specific block matters more here than anywhere.
Memphis, TN. Strong rent-to-value (8.4%) at a $169,000 median. A long-standing investor market with deep rental demand, though property condition and tenant screening deserve extra attention.
Pittsburgh, PA. The most balanced pick: solid 7.4% rent-to-value, the second-best affordability (3.1x income), and a diversified economy (health care, universities, a growing tech sector) that supports steady tenant demand.
Birmingham, AL. An 8.4% rent-to-value plus low Alabama property taxes help cashflow. An entry price under $160,000 keeps the down payment small.
Milwaukee, WI and Indianapolis, IN. Both land in the sweet spot: mid-$180Ks to mid-$220Ks entry, rent-to-value near 6 to 7%, and affordability around 3.4x. Indianapolis in particular pairs that with steady population growth. Two of these have a full breakdown of their own: San Antonio and Indianapolis.
What the two metrics mean
If you are new to the numbers, here is the short version.
Rent-to-value is a cousin of the 1% rule (a property where monthly rent is about 1% of price tends to cashflow). An 11% annual rent-to-value is roughly 0.9% per month, near that threshold. For the full framing, see the 1% rule explained.
Price-to-income tells you whether a normal local salary can plausibly buy in. A 2.5x city (Cleveland) is far more reachable for a first-time buyer than a 4.4x city (Cincinnati), even before financing.
Neither metric is the whole story, which is the next section.
What this data cannot tell you
A ranking built on citywide medians is a filter, not a final answer. Before you buy anywhere on this list, the data cannot see:
- Neighborhood variation. A city median hides blocks that are much better or worse. Cleveland's 11% ratio is a citywide average; individual neighborhoods range widely.
- Property taxes. These vary a lot by state and county and hit cashflow directly. Alabama runs low, Texas and parts of the Midwest run high. Always pull the actual post-sale tax bill.
- Small-multifamily supply and price. Duplex and triplex inventory, and how it is priced versus single-family, differs by market.
- Local rental rules and condition. Landlord registration, inspections, and the age and condition of the housing stock all matter.
- Vacancy and demand. Nationally the rental vacancy rate was 7.3% in early 2026 per Census housing data; your submarket may run higher or lower.
Tenant demand also follows where people move. Census figures on annual mover rates show a large share of the population relocates each year, and the metros with steady job and population growth (Indianapolis, Columbus, San Antonio) tend to keep units filled.
How to use this list
- Shortlist 2 or 3 cities from the table that fit your budget and, ideally, somewhere you would actually live for a year (house hacking means occupying a unit).
- Confirm financing. House hacking usually runs on FHA financing (as little as 3.5% down on a 2-to-4-unit you occupy). Mortgage rates drive your payment, so track the current 30-year rate.
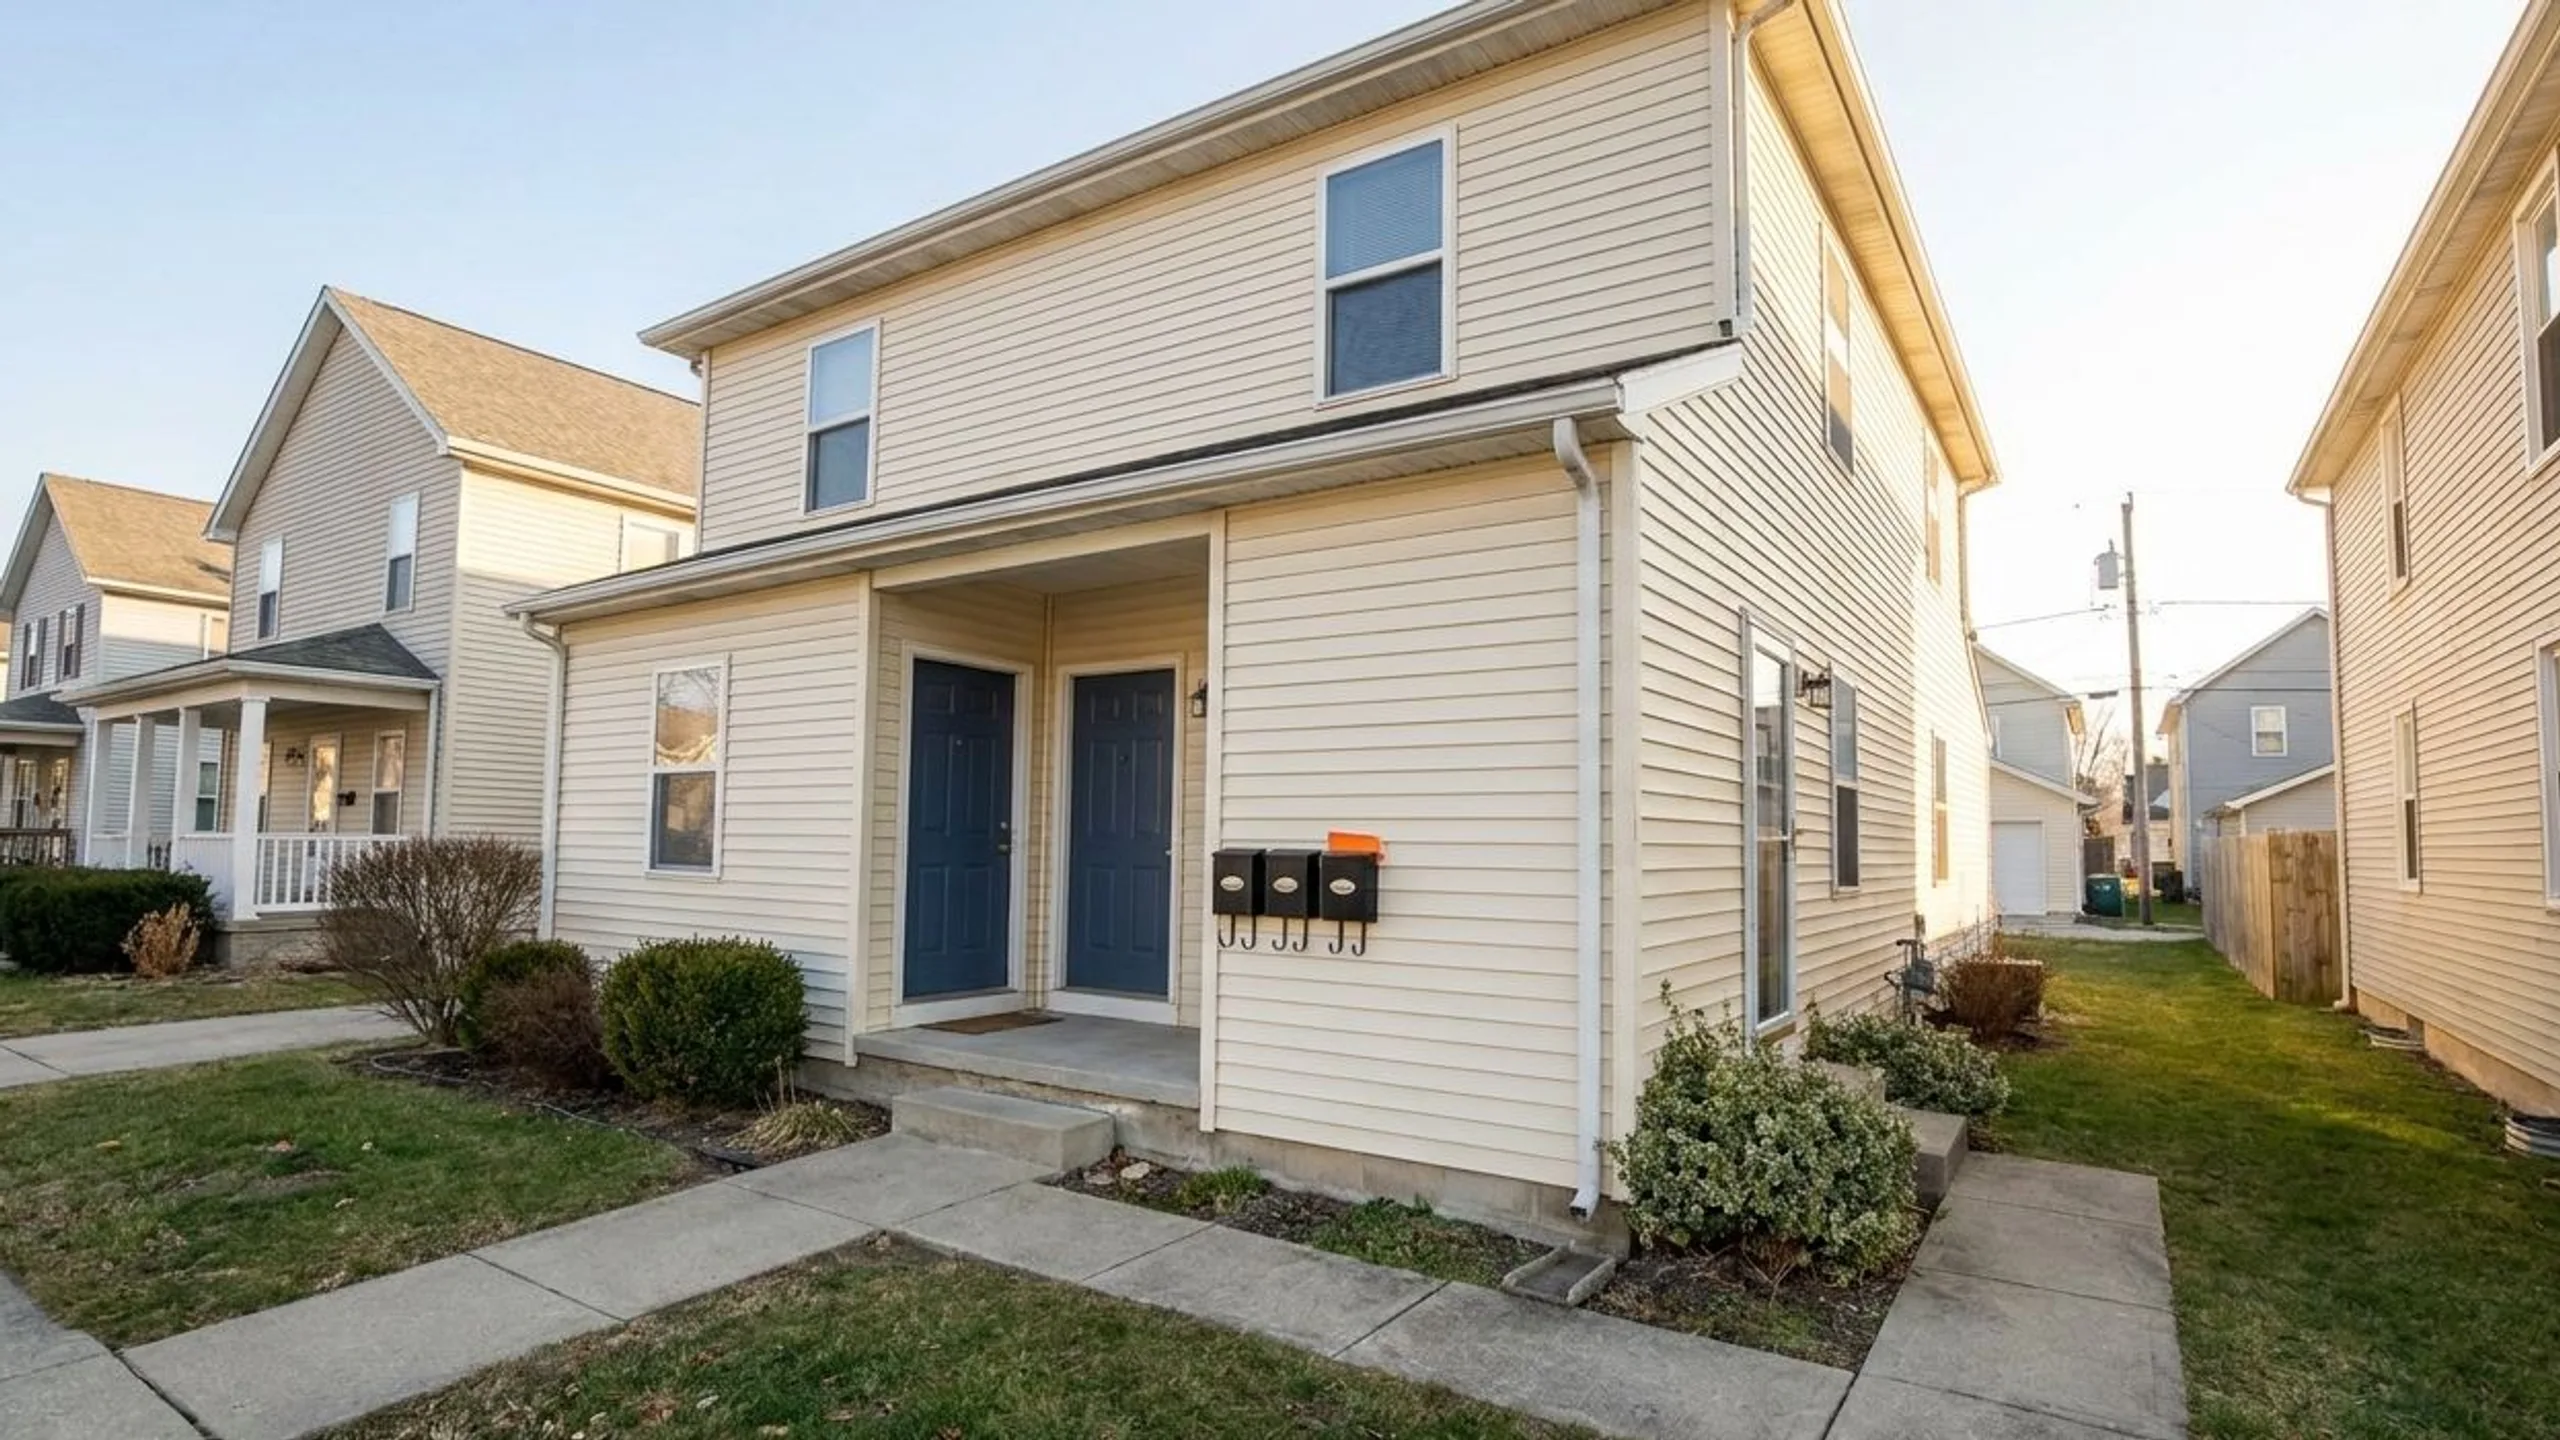
- Pick a structure: single-family with a rented room, or a small multi-unit. See single-family vs duplex house hacking.
- Run the actual numbers on real listings, not the city median. Run each one through the free house hacking calculator, then dig deeper with how to analyze a house hack before you buy, and budget cash reserves on top of the down payment.
- Narrow the submarket with the framework in how to pick a city for real estate investing.
Frequently Asked Questions
What is the best city for house hacking in 2026?
By the Census data, Cleveland ranks first: a $102,000 median home value against $945 median rent gives the highest rent-to-value ratio (11.1%) and the best affordability (2.5x income) of any large metro on our list. Memphis, Pittsburgh, and Birmingham follow closely. The caveat is that Cleveland's citywide numbers hide wide neighborhood differences, so screening the specific block is essential.
What makes a city good for house hacking?
Three things: a low home price relative to local income (so a normal salary can buy in), strong rent relative to price (so tenants cover most of the mortgage), and enough rental demand to keep units filled. Affordable Midwest and Southern metros tend to score best because prices stayed low while rents held up. Financing matters too, since house hacking usually uses an FHA loan on a 2-to-4-unit property.
Is house hacking better in the Midwest?
The data says yes for cashflow and affordability. Nine of our top 11 cities sit in the Midwest or South. These markets keep entry prices well under $250,000 while rents stay high enough to produce healthy rent-to-value ratios. Coastal metros fail both tests: high prices and price-to-income ratios that put a first purchase out of reach on a normal salary.
How much money do you need to house hack in these cities?
With FHA financing at 3.5% down, a $200,000 duplex needs about $7,000 down plus closing costs. On a cheaper Cleveland or Birmingham property, the down payment can be under $6,000. Budget separate cash reserves on top, since both lenders and prudence call for a cushion beyond the down payment.
Does a low median home price mean a city is a good investment?
No. A low price is a filter, not a verdict. Property taxes, neighborhood quality, the age and condition of the housing, local landlord rules, and tenant demand all decide whether any single deal works. The cheapest cities often have the widest gap between good and bad blocks, so a low citywide median raises, not lowers, the need to screen the specific property.
What data is this house-hacking ranking based on?
U.S. Census Bureau American Community Survey (ACS) 2024 estimates for median home value, median gross rent, and median household income in each city. We computed rent-to-value (annual rent divided by home value) and price-to-income (home value divided by income), ranked each city on both metrics, and summed the ranks. Every figure is public and reproducible from the ACS.
Cheap alone is not the goal. The best cities for house hacking are the ones where a first-time buyer can actually afford to buy and the rent actually covers the payment, and by the Census numbers those are concentrated in the affordable Midwest and South. Use the table to shortlist, then run the real numbers on real listings before you commit. To learn the full house-hacking process from financing to first tenant, the 28-day course walks through it in order.
This article is education, not financial, legal, or tax advice. Real estate carries risk, and the numbers here are examples. Check them against your own market and talk to a licensed professional before you buy.